Technical Reference

CALL 1-800-667-7492

T: 1-800-667-7492
- 1) Introduction
- Introduction
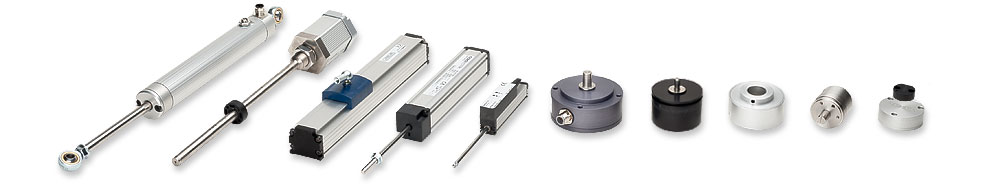
Rapid developments in control engineering and microprocessor and semiconductor technology have resulted in the wide-spread use of electronically controlled systems in every branch of industry. This has created a need for sensors that are inexpensive but, at the same time, sufficiently robust, both electrically and mechanically, to withstand temperatures with a range as wide as -40 to +160 degrees centigrade, particularly in applications involving large quantities Fig. 1 provides a summary of the various types of sensors for angular and linear motion that are in use today.
This paper is concerned with quality criteria (1) and (2) applicable to conductive-plastic potentiometers for use as sensors for angular and linear motion. Such potentiometers essentially comprise the following components:
- The resistance element (support material + a resistance track of conductive plastic) 2. A wiper (precious metal alloy) 3. A drive shaft or actuating rod 4. Bearings (ball bearing or glide bearing) 5. Housing
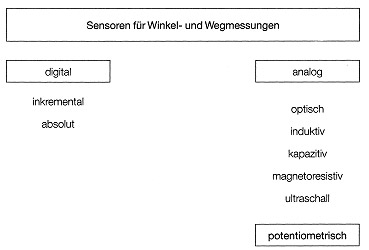
Fig 1.
- 2. Terminology/Terms and Definitions
When we refer to a potentiometer as a sensor, it is important to bear in mind the statements made here only apply if the potentiometer is connected as a voltage divider rather than as a variable resistor (rheostat) (Fig.2). The wiper voltage must be connected, free of load, to an operational amplifier such as a 741, OP 07 or other components with a high input impedance.
Fig. 3 explains the terms used, such as electrical and mechanical travel. L1 indicates the defined electrical travel. L2 indicates the continuity travel which also includes the nonlinear connection fields Fig. 4. L3 indicates the total electrical contact travel of the potentiometer. L4 indicates the mechanical travel. An electrical potential need not be defined for the whole of this travel.
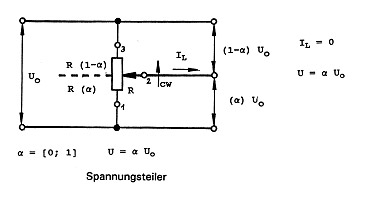
Fig 2.
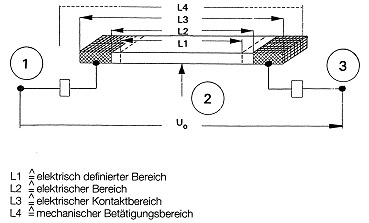
Fig 3.
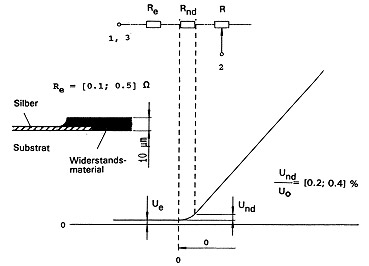
Fig 4.
- 3. Linearity
Of all the quality features mentioned, linearity and conformity are the values most often defined in the existing literature (2). These terms express the extent to which the voltage output from a potentiometer, and also other types of angular of a linear movement sensor, differs from a prescribed theoretical function. In by far the majority of cases, the desired output function is directly proportional to the angle or linear movement that is input.
Formula: Fig. 5.
Whereby m characterizes the gradient, the offset voltage of the potentiometer and the linear or angular travel.
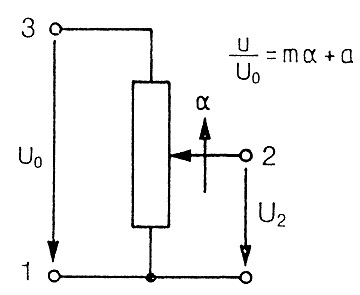
Fig 5.
- 3.1 Independent linearity
If a voltage Uo is applied to a potentiometer with a linear characteristic as in Fig. 5 and the wiper is moved in direction a (standardized movement, angle 0:1 ) then the relationship illustrated in Fig. 6 will exist between the output voltage and the mechanically input value. The maximum deviation of the potentiometer curve from an ideal straight line is referred to as the independent linearity error.
The slope and axis intercept of this straight line can be so chosen that the error f within the travel L1 is minimized. The error +/-f is indicated as a deviation in percentage terms of the output voltage from the theoretical in relation to the input voltage. Since direct measurement of the potentiometer characteristic does not make it possible to assess the extent of such an error, only the difference between the potentiometer characteristic and that of an essentially perfect master potentiometer is plotted as in the practical example given in Fig. 7. Today typical values for independent linearity lie between 0.2 % and 0.02 %.
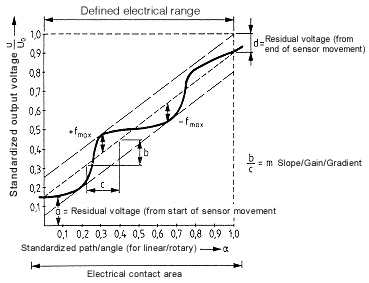
Fig 6.
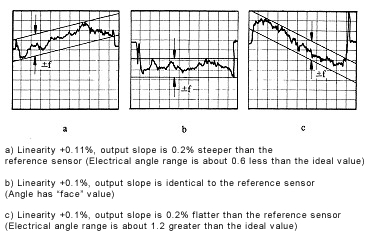
Fig 7.
- 3.2 Absolute linearity
With the ever-increasing automation of assembly lines, users are finding that values for absolute linearity are steadily gaining importance. Unlike independent linearity, for absolute linearity, the reference slope is fully defined (Fig. 8) so that there is no need for subsequent system trimming. The definition of an index point establishes a relationship between the mechanical input value (travel or angle) and the output voltage. Potentiometers whose linearity is defined by these criteria can be installed without a need for subsequent adjustment. As with independent linearity,
it is best to determine the absolute linearity of a potentiometer by comparing its output with that of a master potentiometer. With absolute linearity, it is frequently necessary for the tolerance fields to be stepped. Fig. 9 shows a practical example.
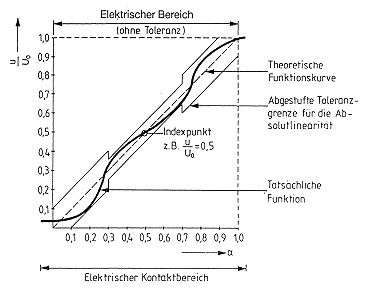
Fig 8.
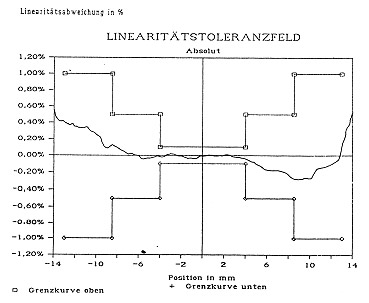
Fig 9.
- 3.3 Absolute conformity
As already indicated under Point 3, conformity is a more general concept than linearity. The definition of absolute conformity is similar to that of absolute linearity. It is essential for an index point to be defined. The functional relationship can be determined mathematically or by plotting a number of points to establish a curve with the aid of suitable interpolation. It is also possible with a potentiometer to achieve steadily increasing or steadily decreasing functions such as logarithmic, exponential, sinusoidal or cosinal functions.
- 4. Contact resistance
Contact resistance is the resistance between the wiper terminal and the wiper's immediate point of contact on the potentiometer's resistive track. As will be subsequently explained, this contact resistance affects all the important quality features of a potentiometer. Contact or transition resistance can be broken down into three components. The first component describes the integral voltage drop between the current-carrying track and the contact surface. This component is largely dependent on technology factors and amounts to several hundred Ohms.
The second component, the external component, is far more difficult to master than the first. This external transition resistance has much in common with the contact resistances occurring in switches and plug-and-socket connectors. It is caused by the transition between the wiper and the potentiometer track not being ideal from an electrical viewpoint. Metal oxides, chlorides and sulphides, mixed with various organic substances, can result in the formation of thin nonconductive facings at the interface. If not kept within bounds, this external transition resistance can, under unfavourable conditions, lead to complete failure to keep within a tolerance range. It is absolutely essential that the materials used in potentiometer manufacture be subjected to stringent quality control and be matched one with another.
The third component, the dynamic component, is related to dynamic drive forces acting on the wiper at high speeds of actuation. With the aid of damped wipers, actuation speeds of up to 10 m/sec can be achieved without any appreciable increase in the dynamic component of contact resistance.
- 5. Linearity errors due to electrical circuitry
From this point on, we are only concerned with linear characteristics (linearity). Relationships must be suitably adapted for applications with non-linear characteristics (conformity) but there are no essential differences. As already mentioned in Section 2, the required linearity values can only be utilized so long as the signal output by the sensor potentiometer carries no current.
Now consider the effect of wiper current on linearity. Fig.10a illustrates the functional relationship between wiper current, contact resistance and linearity error. As is shown by the example in Fig. 10b (Characteristic 4), with a wiper current of 10 µA and a contact resistance of '10 kΩ , a potentiometer which has a resistance of 2 k Ω already has a linearity error of 1.1 %. A similar situation arises with an ohmic load. This clearly shows the importance of the roles played by wiper current and contact resistance.
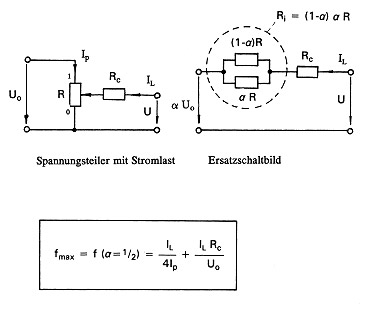
Fig 10a.
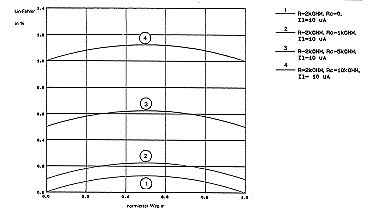
Fig 10b
- 6. Linearity errors resulting from mechanical coupling
If there is axial misalignment (eccentricity) between the drive shaft and the shaft of a potentiometer used to sense angular motion, this will cause a linearity error that increases as the coupling radius decreases in relation to the degree of eccentricity. The following equation determines the maximum relative error:
F max = Eπ¹ ¥ rk
where E = eccentricity and rk = the coupling radius.
It is only possible to take full advantage of the linearity or conformity of potentiometers, as indeed of any rotationary sensor system if coupling alignment errors (offset and angular misalignment) are avoided or at least reduced to a minimum. This means that with highly accurate measurement systems, due allowance must be made for any coup-ling misalignment in accordance with the above equation.
- 7. Smoothness definitions
When some 30 years ago conductive plastic potentiometers were first introduced, it was apparent that, although the winding jumps which were a feature of wire-wound potentiometers had been overcome, absolute smoothness of the output voltage could not be achieved. Following basic research by Wormser (4, 5, 6) the term ÒsmoothnessÓ was included in the standard issued by the Variable Resistive Components Institute (VRCI). Although this definition was adequate at that time it cannot serve as a system definition for many applications. This is because it is now possible to produce potentiometers with appreciably better smoothness and linearity values. For this reason, Novotechnik has sought over the past 15 years to develop definitions better suited to the current state of the art.
The various methods used are discussed and evaluated below.
- 7.1 Smoothness
Smoothness is a measure of the deviations from perfect regularity that appear in the output voltage of a potentiometer. This irregularity is measured over a specified travel increment, for example, 1%, and is expressed as a percentage of the applied voltage. For the measurement of smoothness, the VRCI definition calls for a bandpass filter to be used as a means of suppressing any linearity error and for the potentiometer to be operated with a load resistance (e.g. 100 * Rp). This method has certain disadvantages:
a) The use of a filter causes both absolute wiper velocity and any changes in this velocity to affect smoothness values. Since the filter partly integrates and partly differentiates, the chart-recorded smoothness curve does not accurately indicate variations in the output signal.
b) The load applied to the potentiometer also contributes to an error by causing variation in the contact resistance which is greatest with the wiper at the voltage application end and lowest at the grounded end of the potentiometer track.
c) The use of a 1% evaluation window is not accurate enough for many of today's applications.
d) The sometimes arbitrary selection of a filter type, load resistance and travel increment results in smoothness values not being directly comparable.
- 7.2 Microlinearity
In 1978, Novotechnik introduced the term Microlinearity, which is defined as the maximum linearity variation within travel or angular increment that amounts - as with smoothness measurement - to 1% of the electrical range if nothing to the contrary is defined.
Microlinearity is indicated as a percentage of the absolute voltage that is applied. Fig. 11 illustrates the characteristic obtained for a potentiometer with a micro-linearity error. This was evaluated by a computer-supported system while making linearity measurements.
The travel increments are superimposed on the linearity curve and have an overlap of at least 50 %. Contrary to a smoothness measurement, the error here is purely a linearity error that describes the maximum error within a defined increment.
Microlinearity does not, however, make it possible to determine whether a potentiometer will be suitable for a particular application because variations in gradient (sensitivity) can only be determined with considerable difficulty.
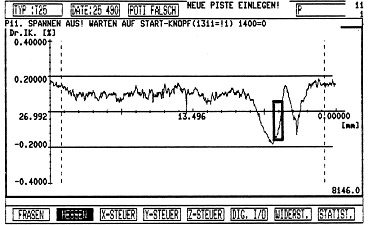
Fig 11.
- 7.3 Relative gradient variation (RGV)
If, in a highly-sensitive control system, the amplification should be arranged so that the control circuit will be stable with the mean slope (gradient) of the sensor. It is important to be aware of any variations in that slope (Fig. 12a, Fig. 12b). If, at any point, the gradient is appreciably steeper than the mean gradient, there will be a higher closed-loop gain in this position and this could lead to feedback oscillation. If, on the other hand, the gradient is less steep at some point than the mean gradient, then repeatability would be reduced and there would be less control accuracy
The relationship of local gradient variation (gl) to the mean gradient (go) of the potentiometer, then this criterion is independent of the potentiometer length and can be used for the direct comparison of various potentiometers.
The RGV is indicated as a +/- deviation in percentage terms from L (standardized mean gradient).
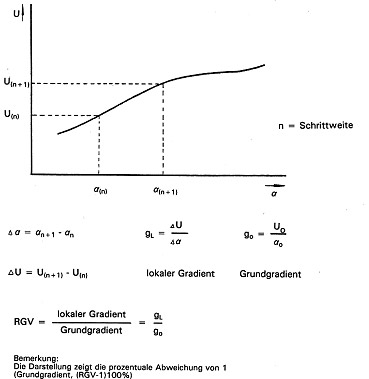
Fig 13.
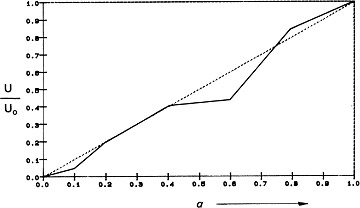
Fig 12a.
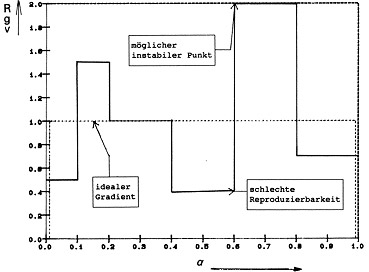
Fig 12b.
- 7.4 Interpretation of RGV
Measurements have shown that with conductive-plastic potentiometers, gradient fluctuations are statistically distributed to travel increments of less than 1µm, i.e. there is no periodicity or regularity. Fig. 14a shows the RGV curve and Fig. 14b the RGV values with step widths of 0.1, 0.2 and 0.3¡. The form of these distributions is more or less in conformity with the normal distribution to be expected in view of the central limit value principle. The mean distribution value is around 1 (mean gradient), the variance (STDEV) decreases as the step width increases. Since each individual RGV value represents a mean value, it is to be expected that the variance of such mean values will decrease with a root function in proportion to the increase in step size, since each such increase amounts to an increase in the size of the random sample.

In Fig. 15 this variance has been plotted as a function of the step width. RGV variance can thus be considered as a characteristic quality feature of a potentiometer. The functional relationship also serves to indicate the maximum resolution of a potentiometer which is not infinite, as many potentiometer manufacturers would imply. Maximum RGV values have also been plotted in Fig. 15. This curve, like the minimum value curve, does not, of course, obey statistical laws but arises from the inclusion of defective positions and faults in the system ?potentiometer? as a whole. These values are vital criteria for assessing the stability and repeatability to be expected of a control system.
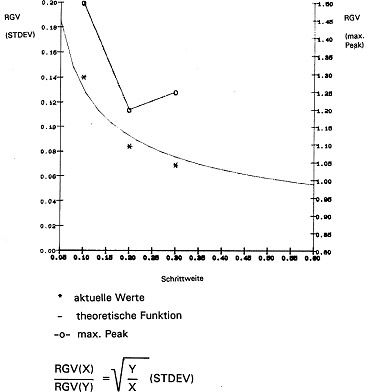
Fig 15.
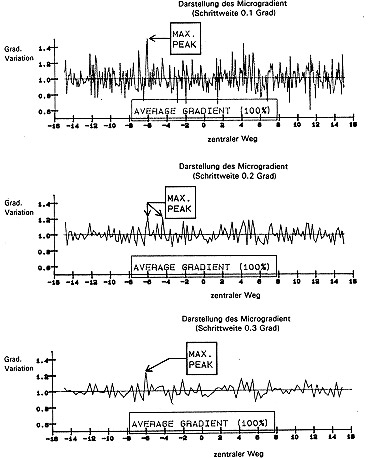
Fig 14a.
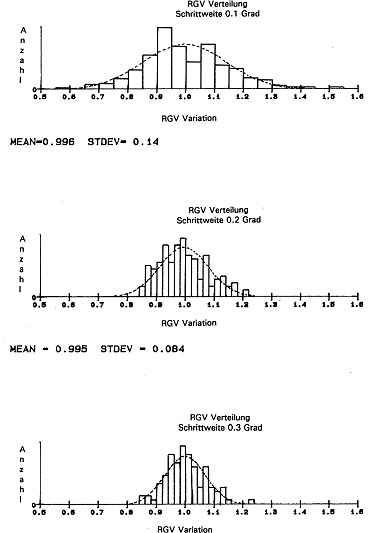
Fig 14b.
- 8.1 Resolution
When measuring RGV values of potentiometers up to synchro size 20 from series production, with step widths of 0.1¡ RGV values of ±10 % are obtained. If we specify the RGV value of ±100 % as the resolution limit, from the equation in 7.4 we obtain with 10 % a resolution of 1/1000¡. The degree of resolution is primarily determined by the homogeneity and grain-size distribution in the conductive plastic layer, by the wiper contact surface running parallel to the equipotential lines (Fig.16a and 16b) and by the wiper current.
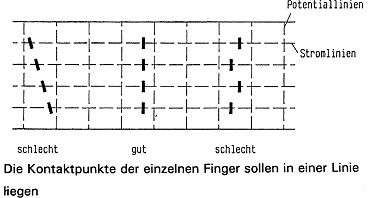
Fig 16a.
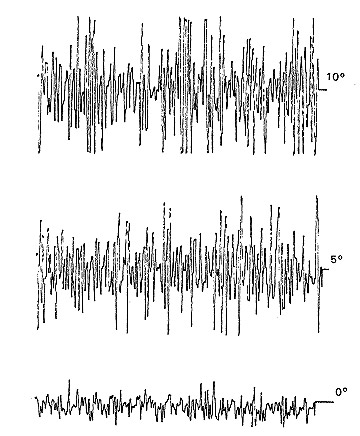
Fig 16b.
- 8. Resolution, hysteresis, repeatability and reproducibility
- 8.2 Hysteresis
The hysteresis value specifies the signal differential resulting if a prescribed position is approached from one side, the point is travelled over and the same position is approached from the other side. Hysteresis is mainly affected by mechanical factors such as the bearings, the stiffness of the wiper system and the coefficient of friction between the conductive layer and the wiper.
For this reason, attention must be paid to ensure a backlash-free, rigid mechanical coupling. This can be achieved using, for example, a spring-borne conical pin or lever. Fig. 18 shows the recorded hysteresis of a Novotechnik standard potentiometer. The measurements were taken with clockwise and counter-clockwise rotations being repeated three times. While the curves recorded in one direction almost coincide (indicating good resolution), in the opposite direction they indicate a hysteresis of around four-thousandths of a degree.
The fact that the curves in one direction almost coincide and that there is a constant hysteresis in the opposite direction indicates a stable displacement of the wiper contact line which means there is no stick-slip effect.
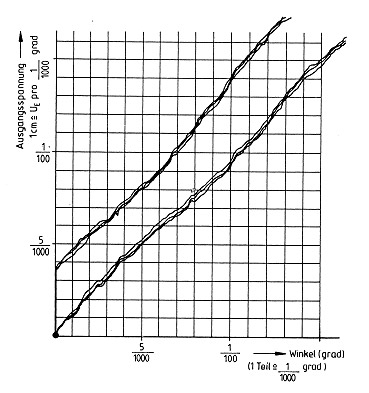
Fig 18.
- 8.2 Hysteresis
The hysteresis value specifies the signal differential resulting if a prescribed position is approached from one side, the point is travelled over and the same position is approached from the other side. Hysteresis is mainly affected by mechanical factors such as the bearings, the stiffness of the wiper system and the coefficient of friction between the conductive layer and the wiper.
For this reason, attention must be paid to ensure a backlash-free, rigid mechanical coupling. This can be achieved using, for example, a spring-borne conical pin or lever. Fig. 18 shows the recorded hysteresis of a Novotechnik standard potentiometer. The measurements were taken with clockwise and counter-clockwise rotations being repeated three times. While the curves recorded in one direction almost coincide (indicating good resolution), in the opposite direction they indicate a hysteresis of around four-thousandths of a degree.
The fact that the curves in one direction almost coincide and that there is a constant hysteresis in the opposite direction indicates a stable displacement of the wiper contact line which means there is no stick-slip effect.
Fig 18.
- 8.3 Repeatability
- 8.4 Reproducibility
- 9. Temperature and humidity coefficients
In many data sheets issued by potentiometer manufacturers, reference is made to the temperature coefficient (Tk) and humidity coefficient (Fk) of the nominal resistance. Where potentiometers are used as voltage dividers (Fig. 2), these values are irrelevant.
In this application, the Tk and Fk applicable to the voltage divider behaviour are significant. It often happens that humidity is not kept constant while making Tk measurements with a result that a mixture of Tk and Fk is often given as a temperature coefficient.
Detailed measurements made by Novotechnik have shown that the Tk and Fk of the nominal resistance in conductive-plastic potentiometers (without housing) are of an order of magnitude some-what less than 200 ppm/¡C and 500 ppm/% RH respectively.
The Tk and Fk of the voltage-divider behaviour are some two orders of magnitude lower. That means that changes within a range of less than 5 ppm/¡C and 5 ppm/% RH can be expected ensuring constancy over a wide temperature and humidity range. However, this advantage can only be utilized given a suitably designed housing and, if, for example, no trimming resistances are used in the potentiometer circuit.
- 10. Service life
The magnitude of contact resistance and wear to which the resistance track is subjected and the resulting change in electrical characteristics determine the number of operations to which a potentiometer can be subjected and thus its service life. Although of considerable importance for industrial applications, no standard has so far been issued that specifies a service life definition or a particular method of testing. It is, of course, most difficult to specify a value for wear or for an increase in contact resistance for a given number of actuation cycles since such values are markedly influenced by such external factors as temperature and humidity, and by mechanical and chemical influences. Such values need to be established for each particular application. This applies to a lesser extent for testing methods, and here the establishment of a standard method would facilitate comparing the service life of various potentiometers.
Unless the customer specifies a different procedure, Novotechnik now uses two methods of testing.
The first is a practical test in which extremely small wiper movements are simulated such as frequently occur in feedback control systems.
Typical values are:
Wiper travel ±2¡ Test frequency 100 Hz.
This dither test provides a relatively rapid result showing contact reliability and any change in gradient within a micro range since, at such a high frequency, some 8.6 million cycles can be affected daily.
The second test, the half-stroke test, gives information concerning linearity changes, zero-point shift and wiper wear.
This test is performed at a frequency of 10 Hz (0.86 million cycles per day) over 50 % of the track length.
As is shown in Fig. 19 this results in a maximum linearity change. A criterion for rejection here might be a doubling of linearity in relation to the state when new and a maximum contact resistance value.
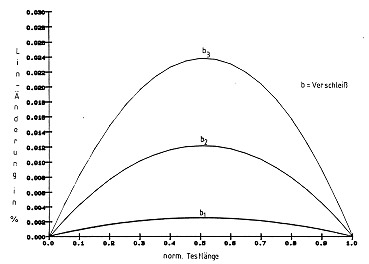
Fig 19.
8. Resolution, hysteresis, repeatability and reproducibility


| Rod Type | Touchless | Side Actuated | Rod Type With Return Spring | in-Cylinder | Open Systems |
| Shaft Type | Touchless Rotary | Hollow Shaft | Multi-Turn | Automotive | Open Systems |
| ABOUT | TERMS AND CONDITIONS | PRIVACY |
© 2000-2023 Novotechnik U.S. Inc., All Rights Reserved